Cutting Apache Doris Build Time from 38 Minutes to 6
A cold Apache Doris BE build went from 38 minutes to 6: lighter header closures, CMake Unity Build, extern template, and line-tables debug info.
I have spent the past few weeks on something that looks a little old-school: making the Apache Doris backend compile faster.
Why now? On my old Linux dev box, a full BE build took one to two hours, which was simply unbearable. I recently moved to a MacBook with an Apple M5 Pro — a large jump in hardware — and a cold build still took close to 40 minutes.
Writing a round of code used to take half an hour on its own. Waiting on the compiler was annoying, but I could step away and do something else. Now an agent produces a patch in minutes, and AI review comes back almost as fast. Compilation has quietly become the slowest stage in the whole loop.
It feels like replacing hand soldering with a pick-and-place machine, and then still testing every finished board one at a time with a multimeter.
This post is a short record of how I fixed that. The complete log — every A/B run and the PRs behind it — lives in the tracking issue apache/doris#66715.
TL;DR
- A cold
doris_bebuild on an Apple M5 Pro (clang 20, ccache disabled,-j5) started at 38 min 54 s. The final same-machine paired run at-j6lands at 11 min 10 s, and at-j14with PCH enabled the build phase finishes in 6 min 18 s. - Round one was pure header-closure surgery on
exec_env.h,runtime_state.h, andthread_context.h. It cut cold-build time by 21.7% and dropped the reach of AWS SDK headers from 769 TUs to 58. - CMake Unity Build was the single biggest lever: 17 BE targets, 110 unity batches, 1,224 source files. The
-j6paired A/B went from 21 min 45 s to 11 min 10 s (−48.7%), with total TU wall time falling from 2 h 01 m to 59 min 14 s. - Adding the missing
extern templatedeclarations cut duplicate weak symbols between two heavy TUs from 1,552 to 491, took another ~2% off cold build, and shrank thedoris_bebinary by 47 MB. - A new
DORIS_DEV_DEBUG_INFO=line-tablesmode cut cold-build time from 12 min 02 s to 10 min 34 s and object files from 4.25 GB to 0.99 GB, while keeping stack traces andfile:line. - None of this was allowed to cost runtime performance: TPC-H SF100 and ClickBench hot totals held at roughly 29 s and 23.8 s, and every expression microbenchmark A/B stayed inside the ±3.5% run-to-run noise band.
1. Apache Doris BE: 38 Minutes to 6 on an Apple M5 Pro
The starting point: 38 min 54 s for a cold Doris BE build on an Apple M5 Pro with clang 20, ccache disabled, and -j5.
| Round | Config | Before | After | Delta |
|---|---|---|---|---|
| Hot-header cleanup | -j5, cold, ccache off |
39 min 21 s | 30 min 48 s | −21.7% |
| Unity Build + template consolidation + more closure cleanup | -j6, paired run |
21 min 45 s | 11 min 10 s | −48.7% |
| Final Unity Build configuration | -j14, PCH on |
7 min 57 s | 6 min 18 s | −20.7% |
Each row is its own paired A/B on the same machine, so the rows do not chain into one multiplication — the parallelism setting and the starting commit differ between them. In the -j6 round, the sum of wall time across all TUs fell from 2 h 01 m to 59 min 14 s, and average TU compile time dropped 43.9%.
The last row is the machine’s ceiling, not a working configuration. -j14 essentially saturates the laptop, and day-to-day development still needs headroom for the IDE, agents, tests, and everything else. The number I actually care about is 11 min 10 s at -j6; 6 min 18 s only shows how far these changes can go under full load.
The difference is real in a way the percentages do not capture. Thirty-eight minutes is long enough to lose the context completely. Ten minutes at -j6 still lets me stay inside the task.
None of this made the CPU work harder. It made the compiler do less unnecessary work, and that came down to three changes.
2. Hot Headers: Feeding Clang Less Irrelevant Code
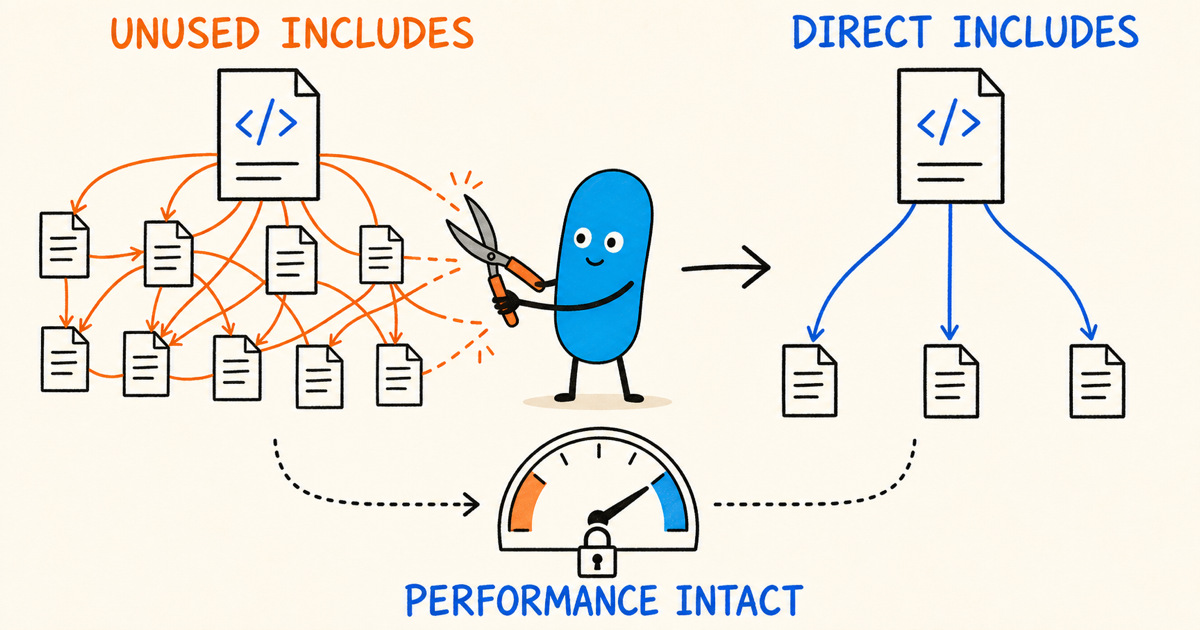
In a large C++ project, a hot header behaves like the backplane on a circuit board. You think you added one wire; you actually routed several megabytes of signal bus into thousands of translation units.
Before the first round, exec_env.h, runtime_state.h, and thread_context.h each reached about 1,000 of the roughly 1,400 TUs under be/src — the same tree that absorbs every new engine feature, from native vector indexes to lake-format readers. Each of those headers also dragged in large amounts of Thrift, Protobuf, and AWS SDK code behind it.
The fix is unglamorous: replace unnecessary includes with forward declarations, move cold-path inline bodies into .cpp files, keep genuinely hot paths inline, add direct includes for the consumers that were freeloading on the transitive ones, and finally add rules so the removed dependency edges cannot creep back.
One number makes the effect concrete: the count of TUs reached by AWS SDK headers fell from 769 to 58. storage/options.h stopped reaching 837 TUs. That round alone took 21.7% off the cold build.
By the end of the series, the natural header closure of multiply.cpp had fallen from 432,000 lines to 243,000. Pulling olap_common.h out of the PCH cut the number of TUs that recompile after a change to that file from 318 to 182.
The work resembles removing old network cables from a server room. Cutting a cable takes a second; the hard part is finding out who has quietly been using it. To make that safe I added compile-bench, rebuild-radius analysis, and a no-PCH closure sweep. Before removing an include edge, I added the direct includes its dependents actually needed. Afterward, I rescanned the whole tree.
2.1 The Hard Rule: No Runtime Cost
Build speed was never allowed to come out of runtime performance.
Removing <ranges> from six BE headers is a good example. Where <algorithm> was a drop-in replacement, I changed the include and nothing else. The code using reverse_view and views::values was rewritten to preserve exactly the same iteration order. After the full BE unit test suite passed, Performance CI ran TPC-H SF100 and ClickBench; their hot totals stayed at roughly 29 s and 23.8 s.
Expression changes are more sensitive, so those went through microbenchmarks instead. The two binaries ran alternately, with the median of five runs taken per group. Every A/B result landed inside the ±3.5% run-to-run noise band, which is what convinced me the compile-time work had not moved runtime performance.
3. CMake Unity Build: Parsing a Header Closure Once
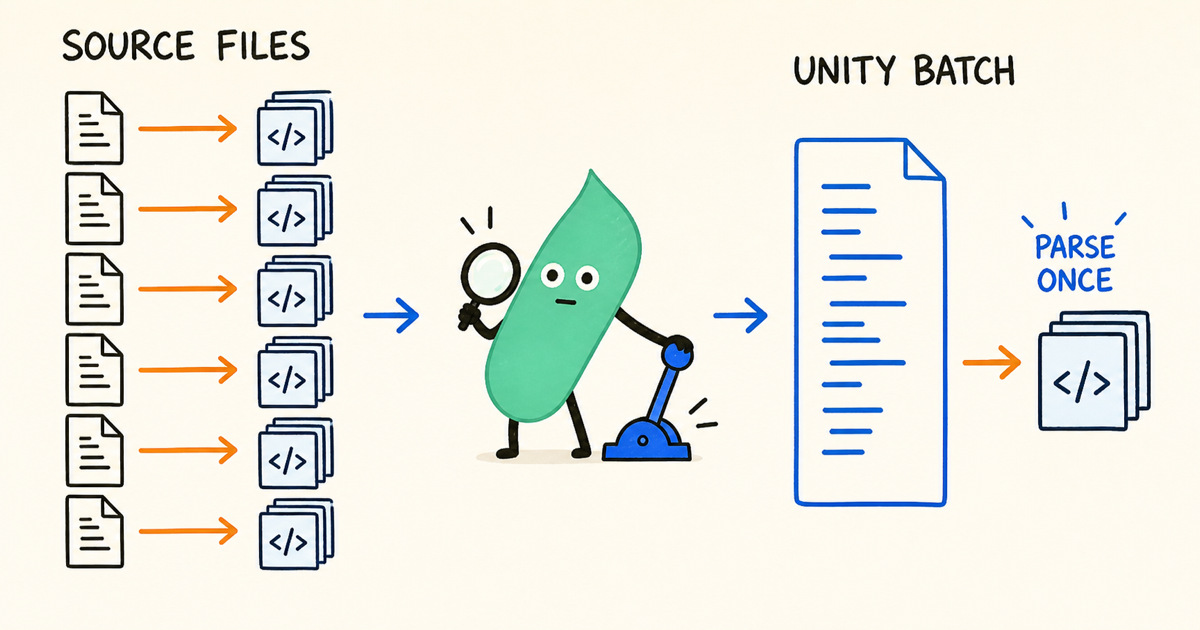
Many .cpp files contain only a little glue code, yet most of their compile time goes into parsing the same headers over and over. CMake’s Unity Build merges several .cpp files into one jumbo TU, so each batch pays for its shared header closure exactly once.
This was the biggest lever in the entire effort.
I piloted it in three modules — Information Schema, HTTP, and Storage Index — then expanded to Exec, Exprs, and others. The final configuration covers 17 BE targets, 110 unity batches, and 1,224 source files.
Why not merge every .cpp at once? Unity Build amplifies file-scope symbol collisions, macro leakage, and memory pressure inside jumbo TUs. Template-heavy files, generated code, and .cpp files that tests #include again all have to stay outside the batches.
There was one instructive bad case. Applying a batch size of 8 to the entire Service target pushed slot time from 104 s to 132 s. In the end I kept only the HTTP portion in Unity Build there, and added ENABLE_UNITY_BUILD=OFF as a per-file escape hatch.
Unity Build also flushed out a set of latent problems: missing include guards, duplicate file-scope names, and two bugs that had been bound to the wrong ErrorCode. Only when the tide goes out do you find out who has been swimming naked.
4. extern template and Debug Info: Generating Code Once
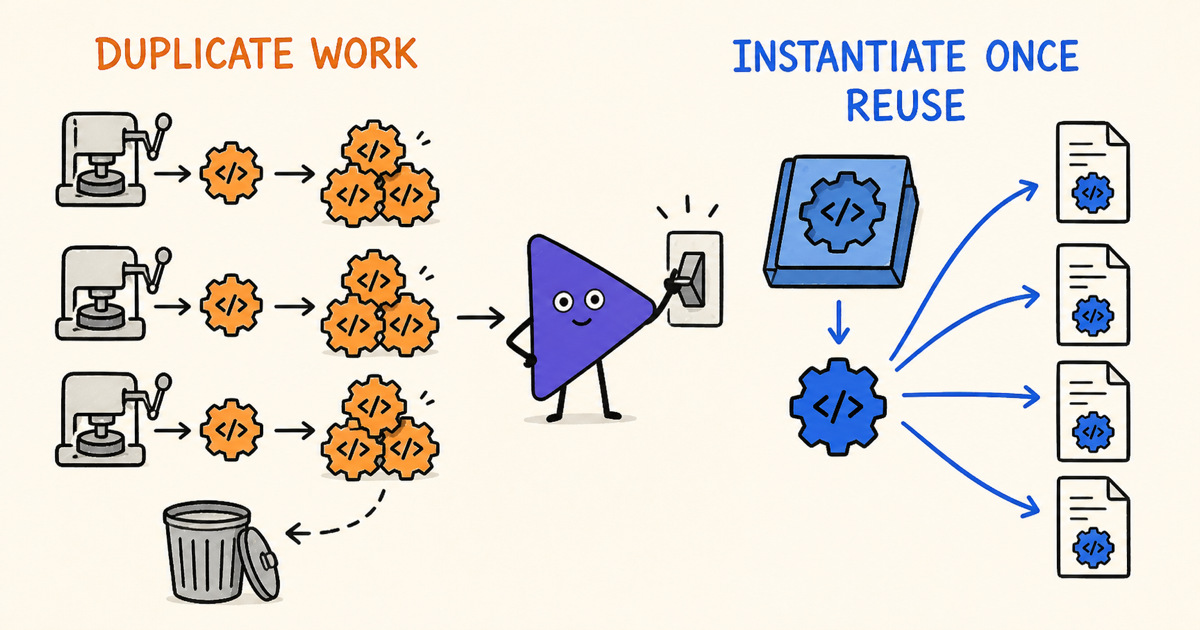
Doris already had plenty of explicit template instantiations, but the headers were missing the matching extern template declarations. So every consumer TU still instantiated the templates itself, and the linker threw away the duplicate weak symbols at the end. The same work was done many times over so that exactly one copy could survive.
After I added the missing declarations, the duplicate weak symbols shared by two heavy TUs fell from 1,552 to 491. In a standalone test taken before the Unity Build changes merged, cold-build time dropped another 2% and doris_be shrank by 47 MB — worth noting next to the 50–80 MB the Rust Lance reader adds to the same binary.
Decimal add, subtract, and mod also registered a set of mixed-width combinations the optimizer will never emit, and those registrations kept manufacturing template instantiations inside BE. Deleting them moved full-build time by only 0.15%, but several heavy expression TUs got 30% to 40% faster.
The last item was debug information. In one complete Release build, the code section was about 150 MB while .debug_* occupied 4.01 GB. When development and CI only need stack traces and file:line, generating full variable-level DWARF is waste.
So I added DORIS_DEV_DEBUG_INFO=line-tables, which maps onto clang’s line-tables-only debug output. In an A/B on the same commit, cold-build time fell from 12 min 02 s to 10 min 34 s and object files shrank from 4.25 GB to 0.99 GB. When I need to inspect variables in gdb or lldb, I switch back to full.
5. What Is Left in the Doris Header Graph
This work is not finished.
The header with the largest remaining PCH blast radius is status.h. It still has 297 dependents and pulls in roughly 50,000 lines of Protobuf and Thrift runtime code. Several types that field.h stores by value contribute roughly another 45,000 lines of closure. Both costs are well understood, and there is still room for more forward declarations and lighter header splits.
The more aggressive option is consolidating the bool variants in the Decimal kernels. Some kernels compile four copies of the same code because of two bool combinations; in principle that could be halved. But this reaches into runtime hot paths, so the threshold is simple: if a microbenchmark regresses by more than 2%, the change is abandoned. As above — build optimization does not get to spend runtime performance.
6. Compile Time Is the New Bottleneck in the Agent Loop
Discussions about developer productivity used to center on editors, languages, and test frameworks. The loop now looks like this:
1
2
3
4
5
6
7
8
9
Agent produces a patch
↓
Compiler produces a binary
↓
Tests validate it
↓
AI review
↓
Next patch
The speed of the loop is the speed of its slowest stage. To avoid sitting through another build, people start batching changes: PRs get larger, diagnosis takes longer, and even AI review gets less effective as the diff grows.
In the first half of this shift, everyone competed on generating code faster. In the second half, large projects will compete on validating that code faster.
If an agent finishes a patch in five minutes and then waits 38 minutes to learn whether it works, even the smartest model is just standing in line at the door.
Build less, iterate faster.
7. Follow the Work
- The full record: apache/doris#66715 — every A/B run, every PR, including the ones that made things worse.
- The source: Apache Doris on GitHub. The knobs mentioned here are
ENABLE_UNITY_BUILDandDORIS_DEV_DEBUG_INFO. - The release: Apache Doris download.
- Questions or pushback: the Apache Doris community Slack, or the tracking issue above. If you have measured similar work on another large C++ codebase, I would like to compare notes.